.svg)


The economics of home services are deceptively simple.
Your technicians perform a high volume of short visits. The tighter your routes, the more stops you fit in a day. The more problems you fix the first time, the fewer callbacks eating into tomorrow’s capacity. The better the experience, the more likely that customer renews, refers a neighbor, and leaves a five-star review that feeds your next lead. It’s a straightforward formula.
Every lever that matters (revenue per route, capacity utilization, retention, reputation) traces back to the same place: technician performance. As an owner, figuring out how to get the absolute most out of your team is foundational to profitability.
But what does a high-performing technician actually look like, and what do the companies that consistently produce them do differently?
To find out, we analyzed over 18,000 performance data points across 3,000 home services companies in the Applause database and surveyed 555 in-field technicians. The resulting dataset covers a broad cross-section of recurring, route-based home services businesses, from HVAC and pest control to lawn and landscaping.
What we found challenges some widely held assumptions about where operational leverage actually comes from. In this article, we'll provide a sneak peak at some of our findings. For a more in-depth look at the data, download the full report.
Key takeaways
- 73% of technicians have five years of experience or less. The industry runs on early-career talent. Investing in good training and onboarding is more important than hiring experienced industry veterans.
- 70.3% of techs complete 10+ visits per day, and 90% spend 60 minutes or less on-site per visit. If you have technicians regularly getting in 8 or fewer service visits a day, you’re losing revenue opportunities.
- 65.4% of technicians drive less than one hour per day between appointments. The best operators have nearly eliminated transit friction. If your routes aren’t extremely tight, you’re paying for too much non-revenue time. This is an easy place to improve efficiency.
- 80.9% of technicians report a reservice rate below 5%. So that’s far below the 20–25% industry average. This means owners can recalibrate their expectations. Consistent, high-quality service is possible.
- Applause customers collect 5–10x the review volume of the average home services SMB, with 82% maintaining a 4.8+ star rating.
- Customer satisfaction is the #1 technician motivator (38.9%), right in front of pay and bonuses (27.6%). Financial incentives are important, but your team wants to know they did a good job. Letting them see positive customer feedback throughout the day gives them a regular hit of dopamine to keep them motivated throughout the day.
- 80.5% of technicians receive bonuses tied to customer reviews, making it the most common performance incentive in the industry. If your team doesn’t seem motivated to go above and beyond, small performance bonuses for reviews is a good place to start.
Average technician tenure: Your workforce is younger than you think
In addition to analyzing technician performance data, we also gathered demographic information to understand the typical profile of a high-performing technician.
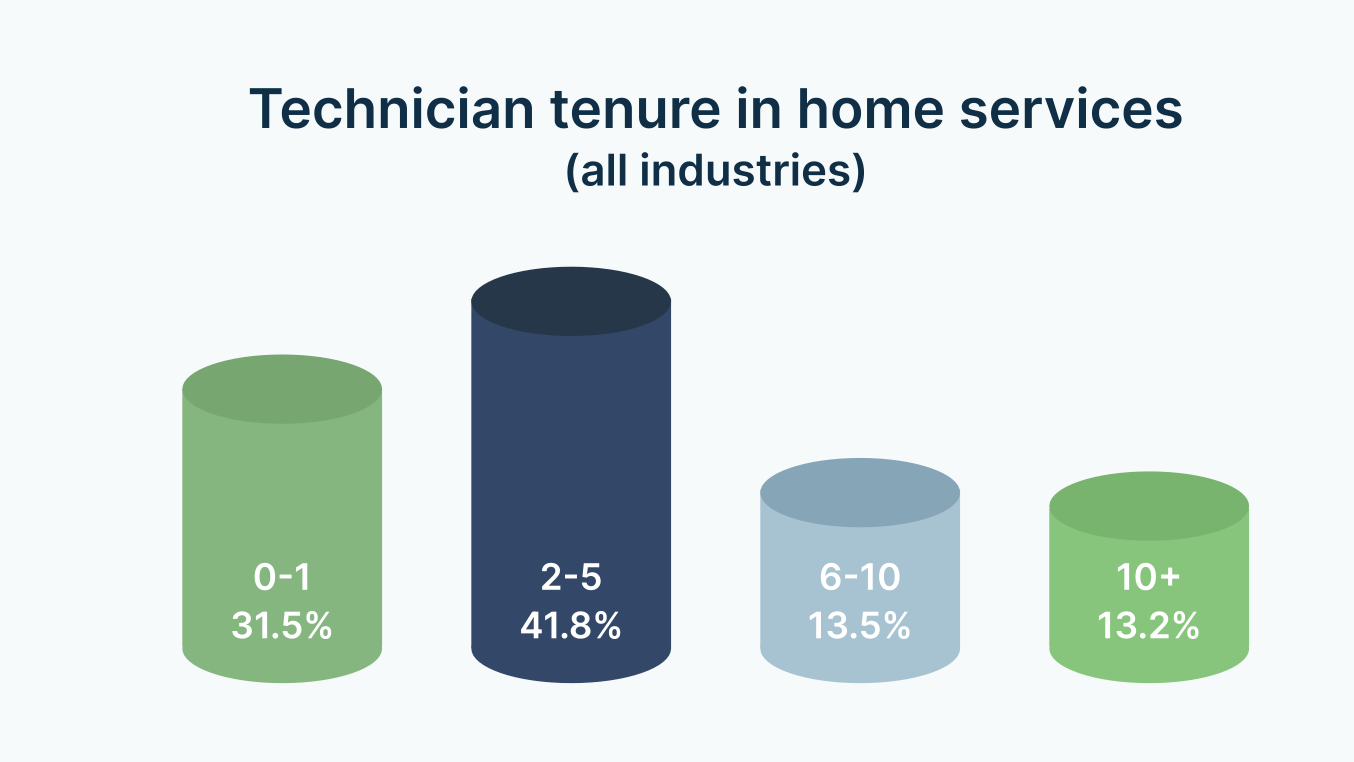
We found that 73% of home services technicians have five years of experience or less. Nearly a third (31.5%) are in their first year on the job. Only 13.2% have been in the industry for more than a decade. This pattern held across every vertical we looked at: pest control, lawn care, HVAC. The distribution barely changed.
This matters because a young workforce changes what you should be optimizing for. If most of your team has fewer than five years under their belt, your quality ceiling isn’t determined by how many experienced techs you can recruit. It’s determined by how good your training and onboarding programs are.
The companies in our dataset with the best performance metrics aren’t necessarily the ones with the most tenured teams. They’re the ones that get new techs to competency fastest.
It also means early retention has an outsized impact on your business. Every tech you lose in year one or two resets the training investment to zero and puts a less experienced replacement back on the route.
The compounding cost of that churn shows up everywhere: more reservices, lower review scores, and a constant drain on your recruiting budget. Owners who treat retention as a year-one-through-three problem tend to come out ahead.
Productivity benchmarks: The 10-visit floor
Because revenue in this industry depends on short, high-frequency services, it's crucial for businesses to know how many visits per day their techs should aim for. This provides a good proxy for whether or not you're getting the most out of your team.
In our dataset, 70.3% of technicians said they complete 10 or more service visits per day. Another 11.9% reported 7 to 9 visits. Only 7.9% consistently operate at 1–3 visits per day.
That lines up with what we saw on time-per-visit: 90% of technicians spend 60 minutes or less on-site per customer, and nearly half finish in under 30 minutes. The operating model for most home services businesses is built around high-frequency, short-duration stops. Volume and consistency drive revenue, not long engagements.
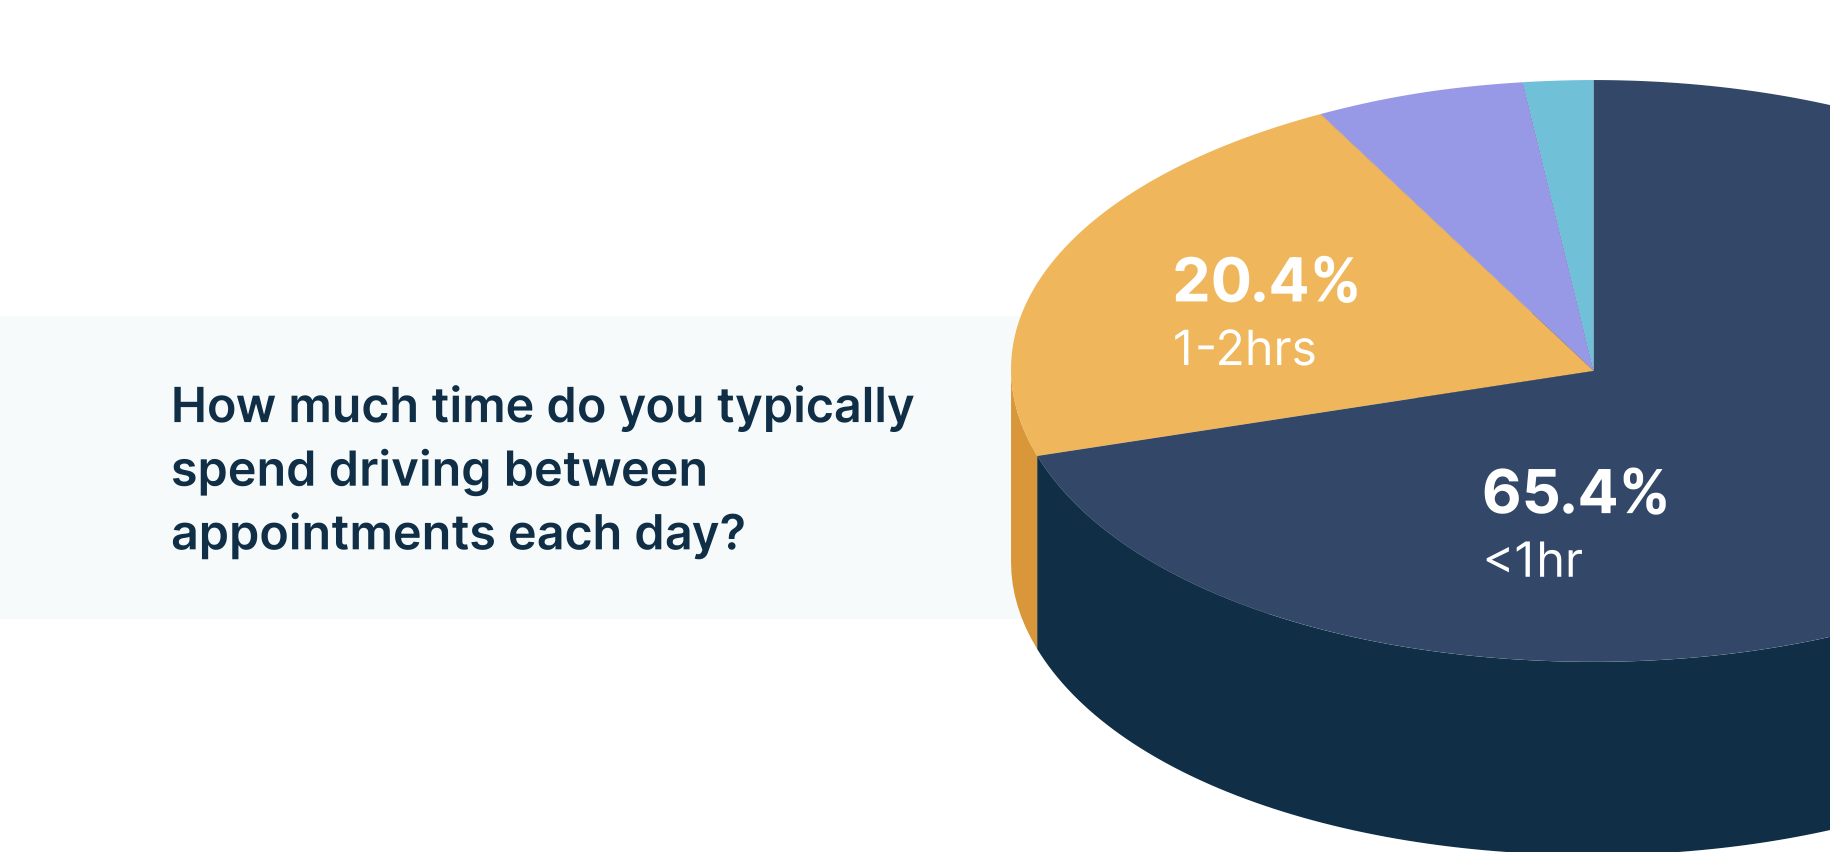
The more revealing number is drive time. 65.4% of technicians spend less than one hour per day driving between appointments. Compare that to the 14.2% spending two or more hours behind the wheel: those techs are losing roughly 25 - 40% of their shift to non-revenue time.
If your techs are consistently completing fewer than 10 visits a day, the bottleneck probably isn’t effort or speed on the job. It’s more likely routing or scheduling.
Efficiency benchmarks: Sub-5% reservice rates are the new standard
Increasing the number of visits your techs squeeze into the day can help to boost revenue. Unless a considerable portion of those visits are reservices that come at the expense of your business.
In home services, first-time fix rates tend to hover around 75- 80%, which puts the typical reservice rate somewhere between 20- 25%. Most industry benchmarks consider anything under 12% to be a sign of a high-performing team.
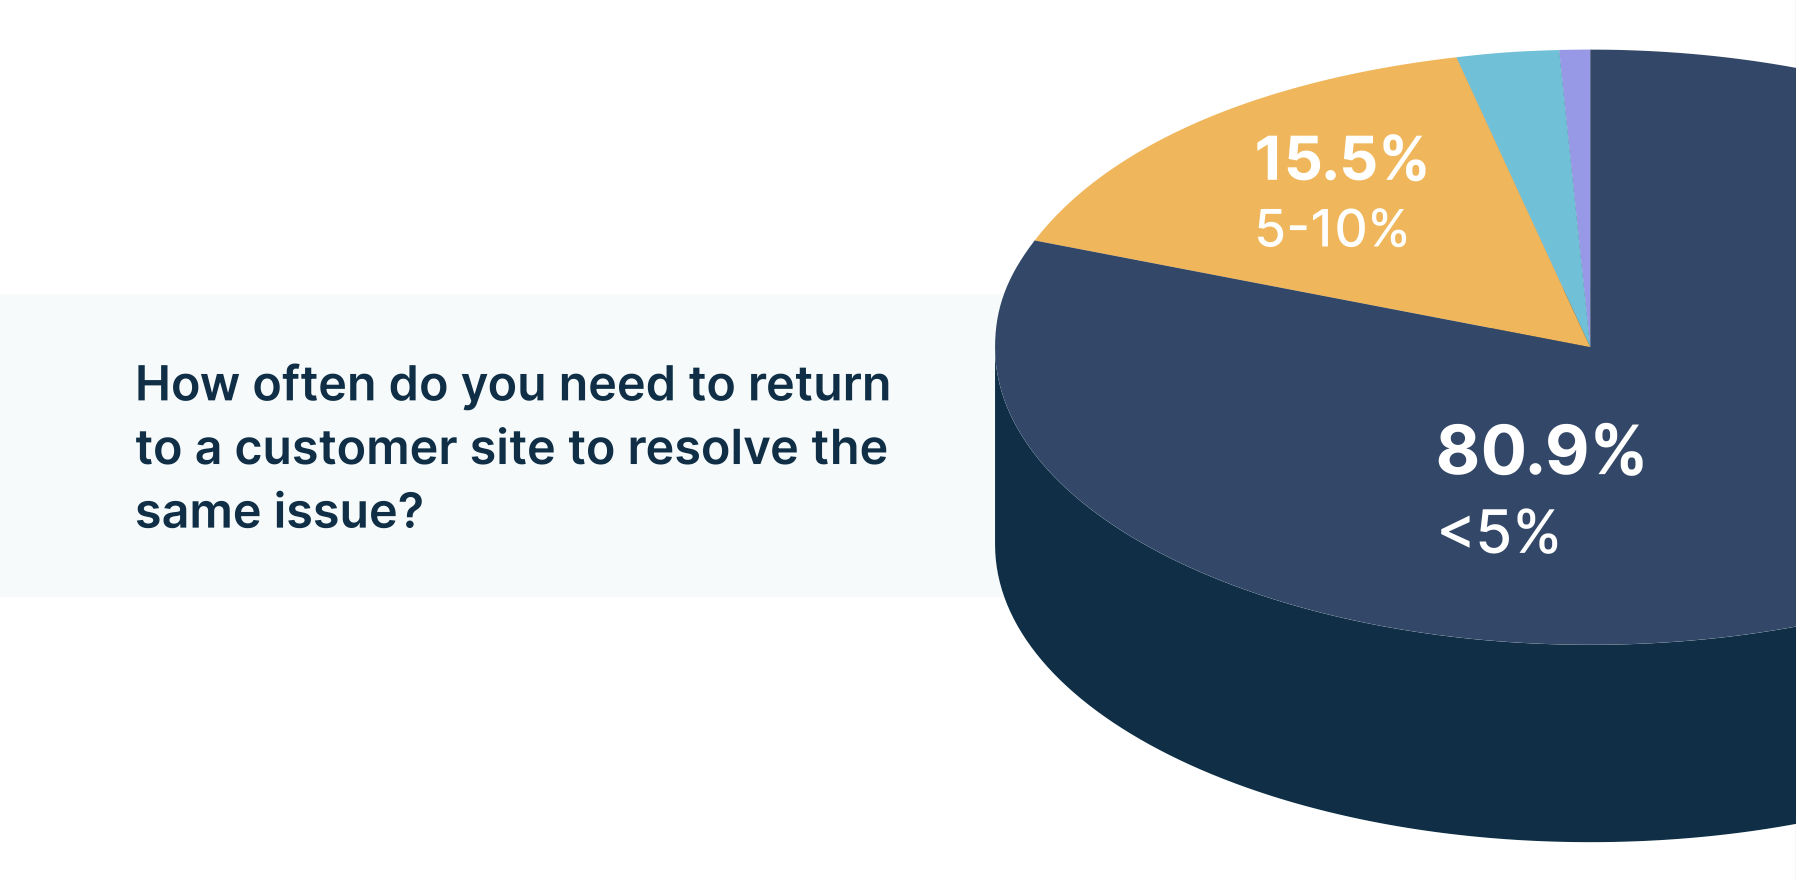
Meanwhile, in our dataset, 80.9% of technicians reported a reservice rate below 5%. Only 3.5% had double-digit reservice rates.
An important caveat: this is an Applause dataset, and Applause users track and incentivize quality by design. The sample skews toward operationally disciplined teams.
The important thing, though, is that our numbers show what’s actually achievable when you’re measuring the right things and giving techs a reason to care about first-time fix. Sub-5% is the standard among companies that actively manage service quality. If your reservices rate is much higher than 5%, there's a lot of room to push your team to do better.
Every callback displaces a revenue-generating visit, doubles the labor cost on that job, and chips away at customer trust. A company running at 20% versus 5% is working with meaningfully less route capacity and worse margins on the same number of customers.
If you’re not tracking reservice rates at the technician level, you’re probably leaving money on the table without realizing it.
Marketing benchmarks: The review gap is bigger than you’d expect
For residential home services businesses, Google is your best marketing engine. Get cited in the Google Map Pack and you're much more likely to get more new business. And one of the simplest ways to break into the Google Map Pack is to get more Google reviews.
But how many reviews does it take to beat out the competition? Most home services businesses have between 40 and 80 Google reviews total. Companies in our dataset collected 5 - 10x that volume. 44% had 500 or more reviews, and over 24% had surpassed 1,000.
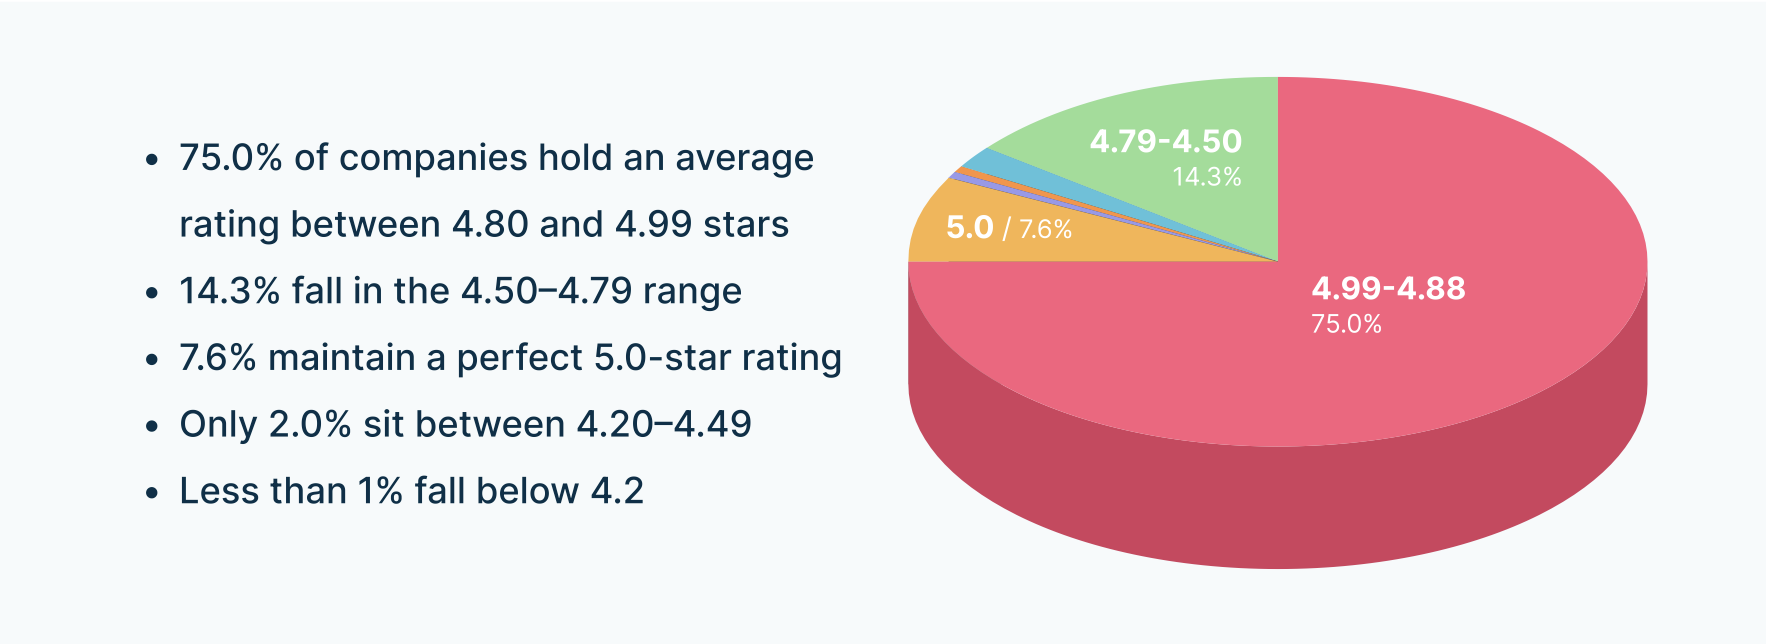
On rating quality, 82% of companies maintained a 4.8 or above on Google. For context, the broader home services average sits around 4.1–4.4, and a 4.5-star rating is considered strong in most local markets. In this dataset, 4.5 stars would put you in the bottom 20%.
So how are these companies generating that kind of volume?
The short answer is they’ve made it part of the job. 80.5% of technicians in our survey receive bonuses tied to customer reviews — it’s the single most common performance incentive in the dataset. The full report breaks down the specific incentive structures and review collection workflows that drive these numbers.
Creating top performers: What actually motivates technicians
In our analysis, we learned that building a team of top performers is less about hiring experienced talent and more about creating top performers from the ground-up. Even inexperienced technicians can outperform vets with the right training and culture.
There's a lot that goes into nurturing engaged, high-performing employees. But a foundational element of boosting performance is doubling down on what motivates your team.
We asked technicians what motivates them most. 38.9% selected customer satisfaction as their primary driver, ahead of pay and bonuses at 27.6% and career growth at 17.1%.
That doesn’t mean compensation doesn’t matter, of course. But it does mean that most of your techs are primarily motivated by knowing they did a good job for the customer. Giving technicians visibility into positive customer feedback throughout the day via review notifications, CSAT scores, or a quick note from a happy customer costs almost nothing and reinforces the behavior you actually want.

The career growth number is also worth thinking about in the context of the tenure data.
If 73% of your workforce has fewer than five years of experience, and 17% of techs say career growth is their top motivator, there’s a real opportunity to use clear advancement paths as a retention tool.
Technicians in their first few years want to know there’s somewhere to go. Skill ladders, certifications, lead tech roles — these don’t have to be complicated, but they need to exist. In a high-turnover industry, giving early-career techs a reason to stay is one of the most cost-effective investments you can make.
What’s in the full report
The full 2026 State of Home Services Benchmark Report goes deeper into:
- Compensation structures and pay models
- On-time arrival benchmarks
- CSAT and NPS distributions
- Training investment levels
- Daily technician challenges
- Detailed methodology and normalization approach
We also outline how high-performing companies translate these benchmarks into operating decisions: how they structure incentives, what they track at the technician level, and where the biggest performance gaps emerge.
If you run a home services business (or advise one), this data is useful when setting targets, rethinking comp plans, or identifying where your operation has the most room to improve.
And for an automated way to track and manage technician performance, chat with our team about Scorecards.
Methodology: Analysis conducted January 2026 using 2025 calendar year data. Platform data drawn from 18,000+ anonymized data points across 3,000 Applause customers. Technician survey conducted with 555 in-field technicians from a randomized sample of Applause users. This dataset reflects companies actively using the Applause platform and skews toward operationally disciplined teams. Benchmarks should be interpreted as high-performer standards, not industry medians.